

Every figure links back through the supplier or dataset that provided it, and the source file that recorded it.
Defensible
Standardised data, labelled factors and a full audit trail, ready for the customer or auditor who asks where a number comes from.
Actionable
Reduction levers with their real value, and a fair way to allocate the result to the customers who pay for it.
Supplier Portal
Supplier figures instead of industry averages
Most of a product footprint sits with suppliers, and a supplier's primary data can be far from the industry average.
The Supplier Portal runs collection as a campaign and follows every response from one dashboard.
A clean, branded form for suppliers
Suppliers share a factor and its provenance, or describe their process and get an estimated factor.
AI summaries of every response
Each answer is flagged: worth a look, needs checking, blocks acceptance.
Accepted data flows straight in
An accepted response replaces the industry average with the supplier's own figure.
It’s a good place to describe image
EF Database
Every factor, its source and its impact
Every calculation rests on emission factors. The EF Database holds the factors your footprints use and a catalogue of 500+ datasets from ecoinvent, Agribalyse, ADEME and USEPA, alongside your own. Each factor is labelled generic, region-specific or supplier-specific, with its breakdown, environmental profile and source version.
Preview before you commit
Pick a candidate dataset and see every product whose footprint would move.
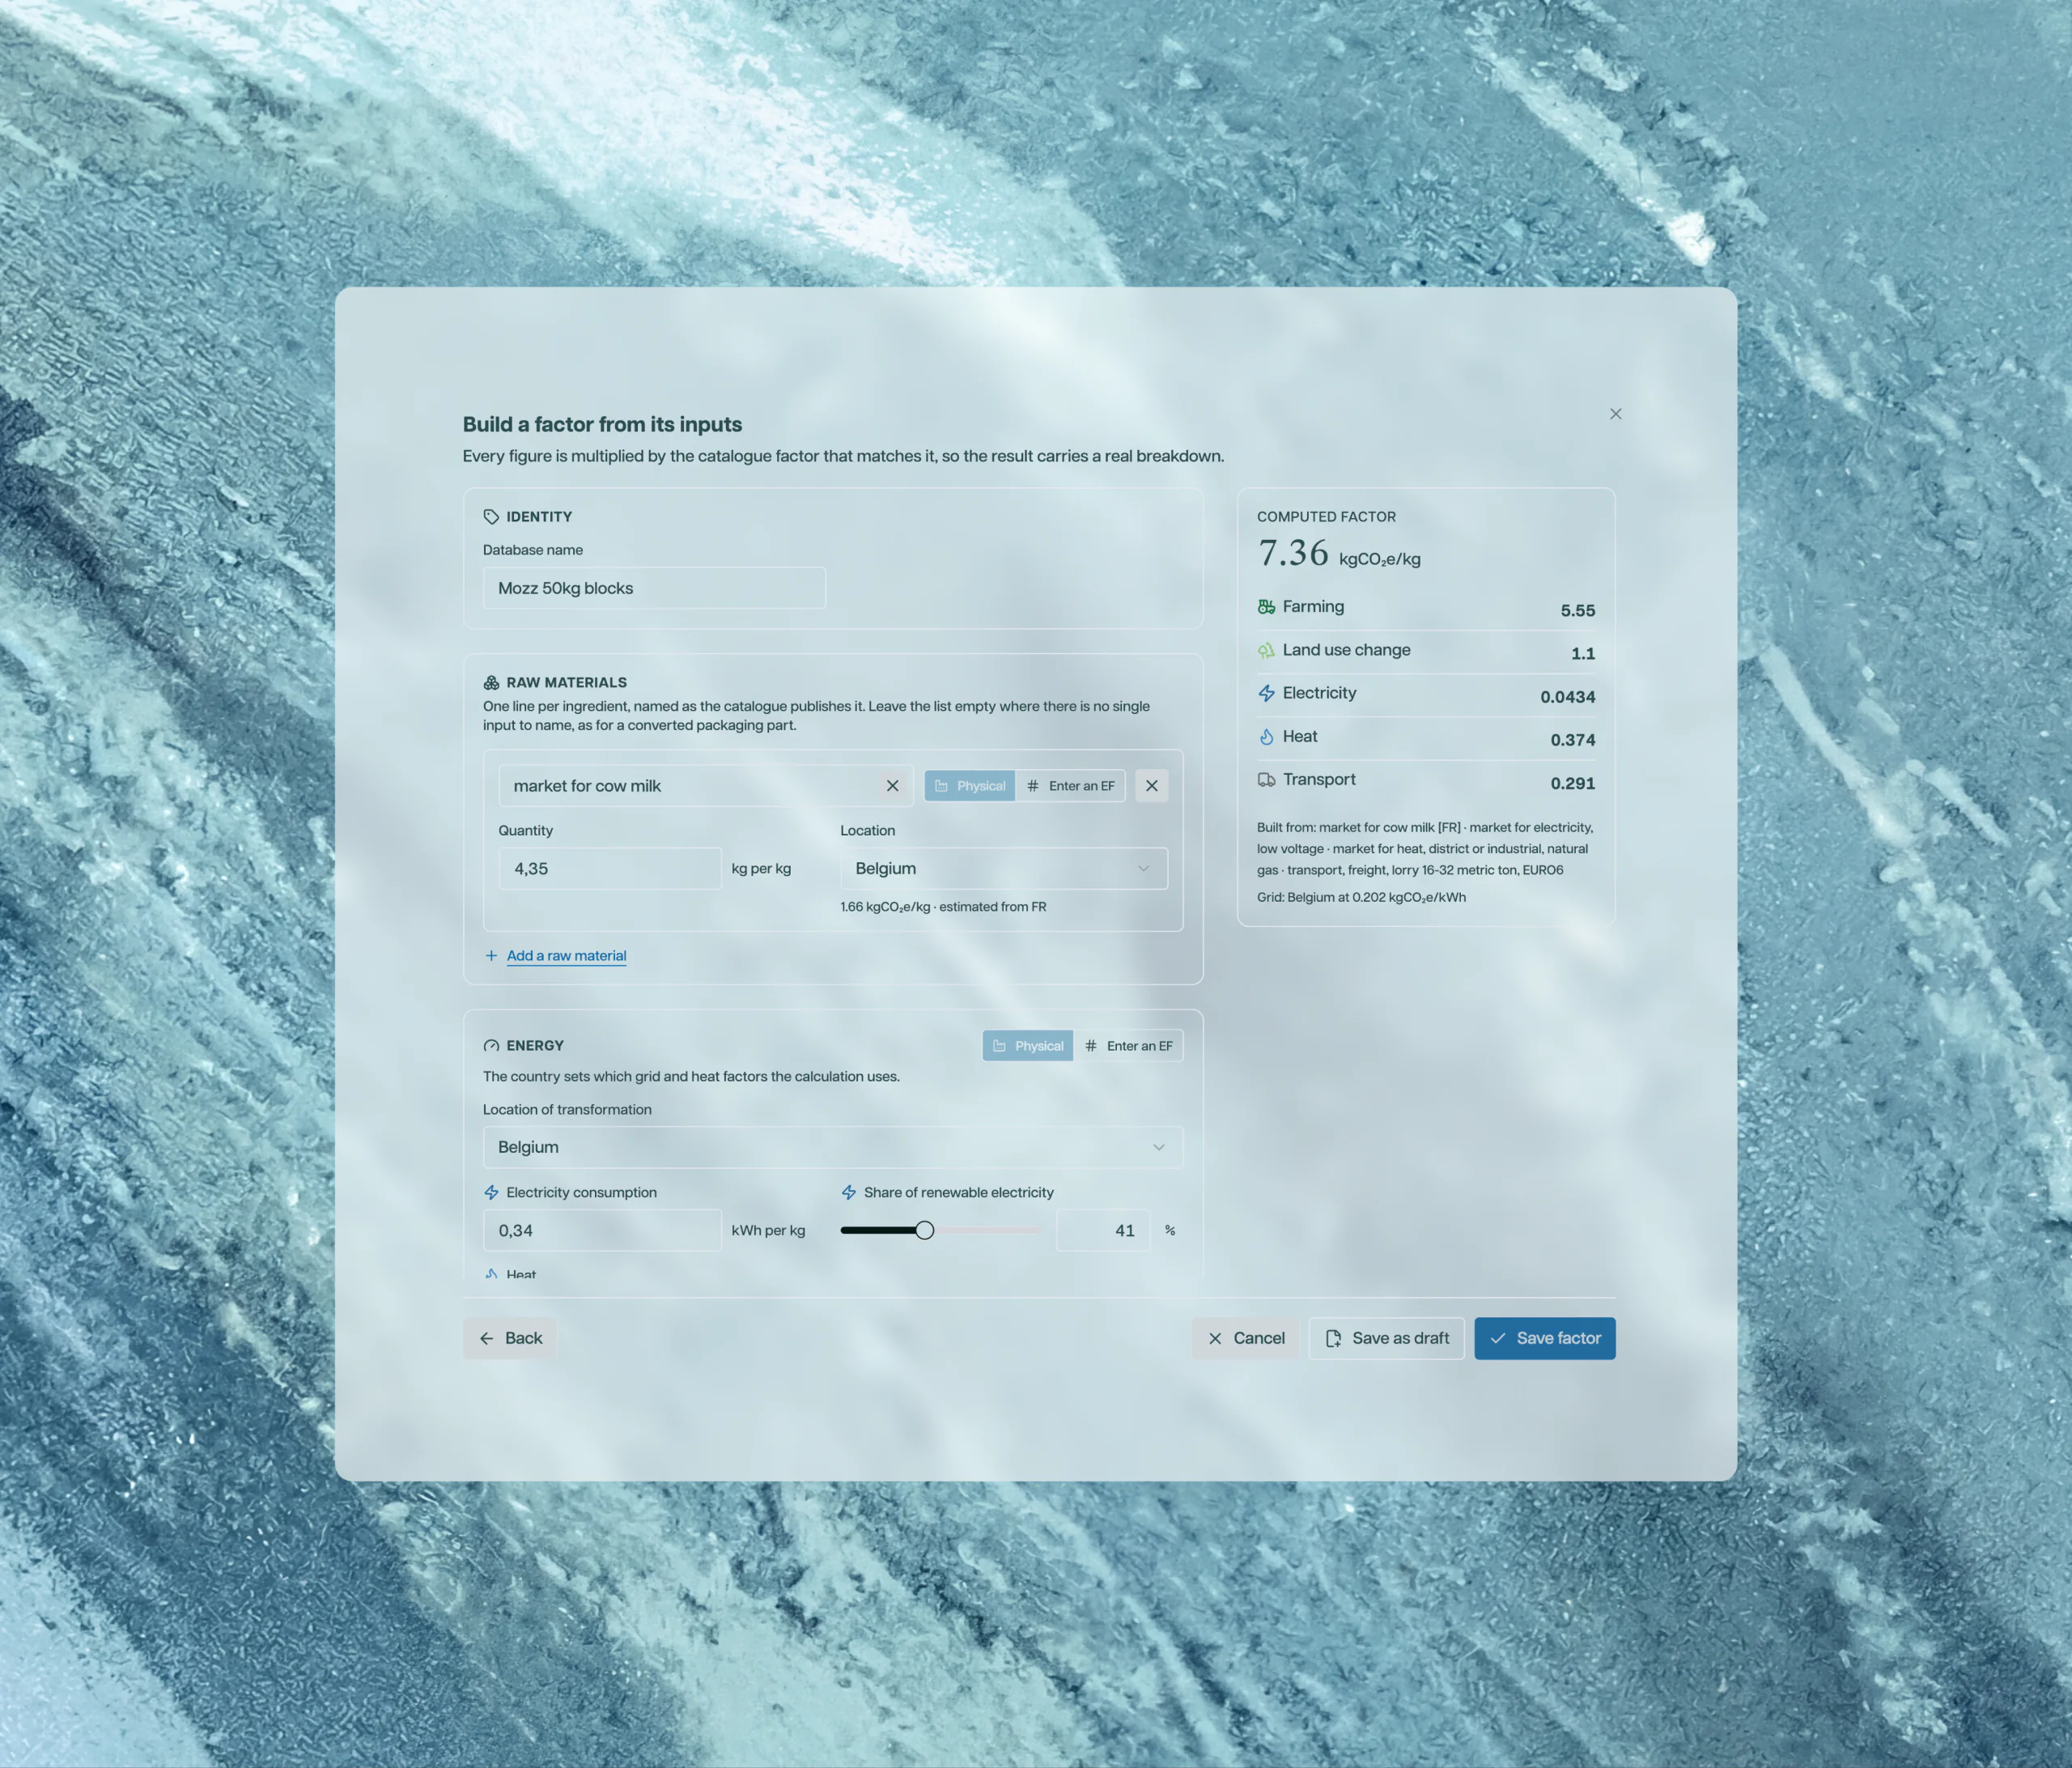
Build your own factor
Describe a process and the platform builds the factor with a real breakdown.
Adapt a published dataset
Change only what differs for you and save it as your own factor.
PCF Analysis
Analyse, reduce and allocate every footprint
Analyse
Visualize
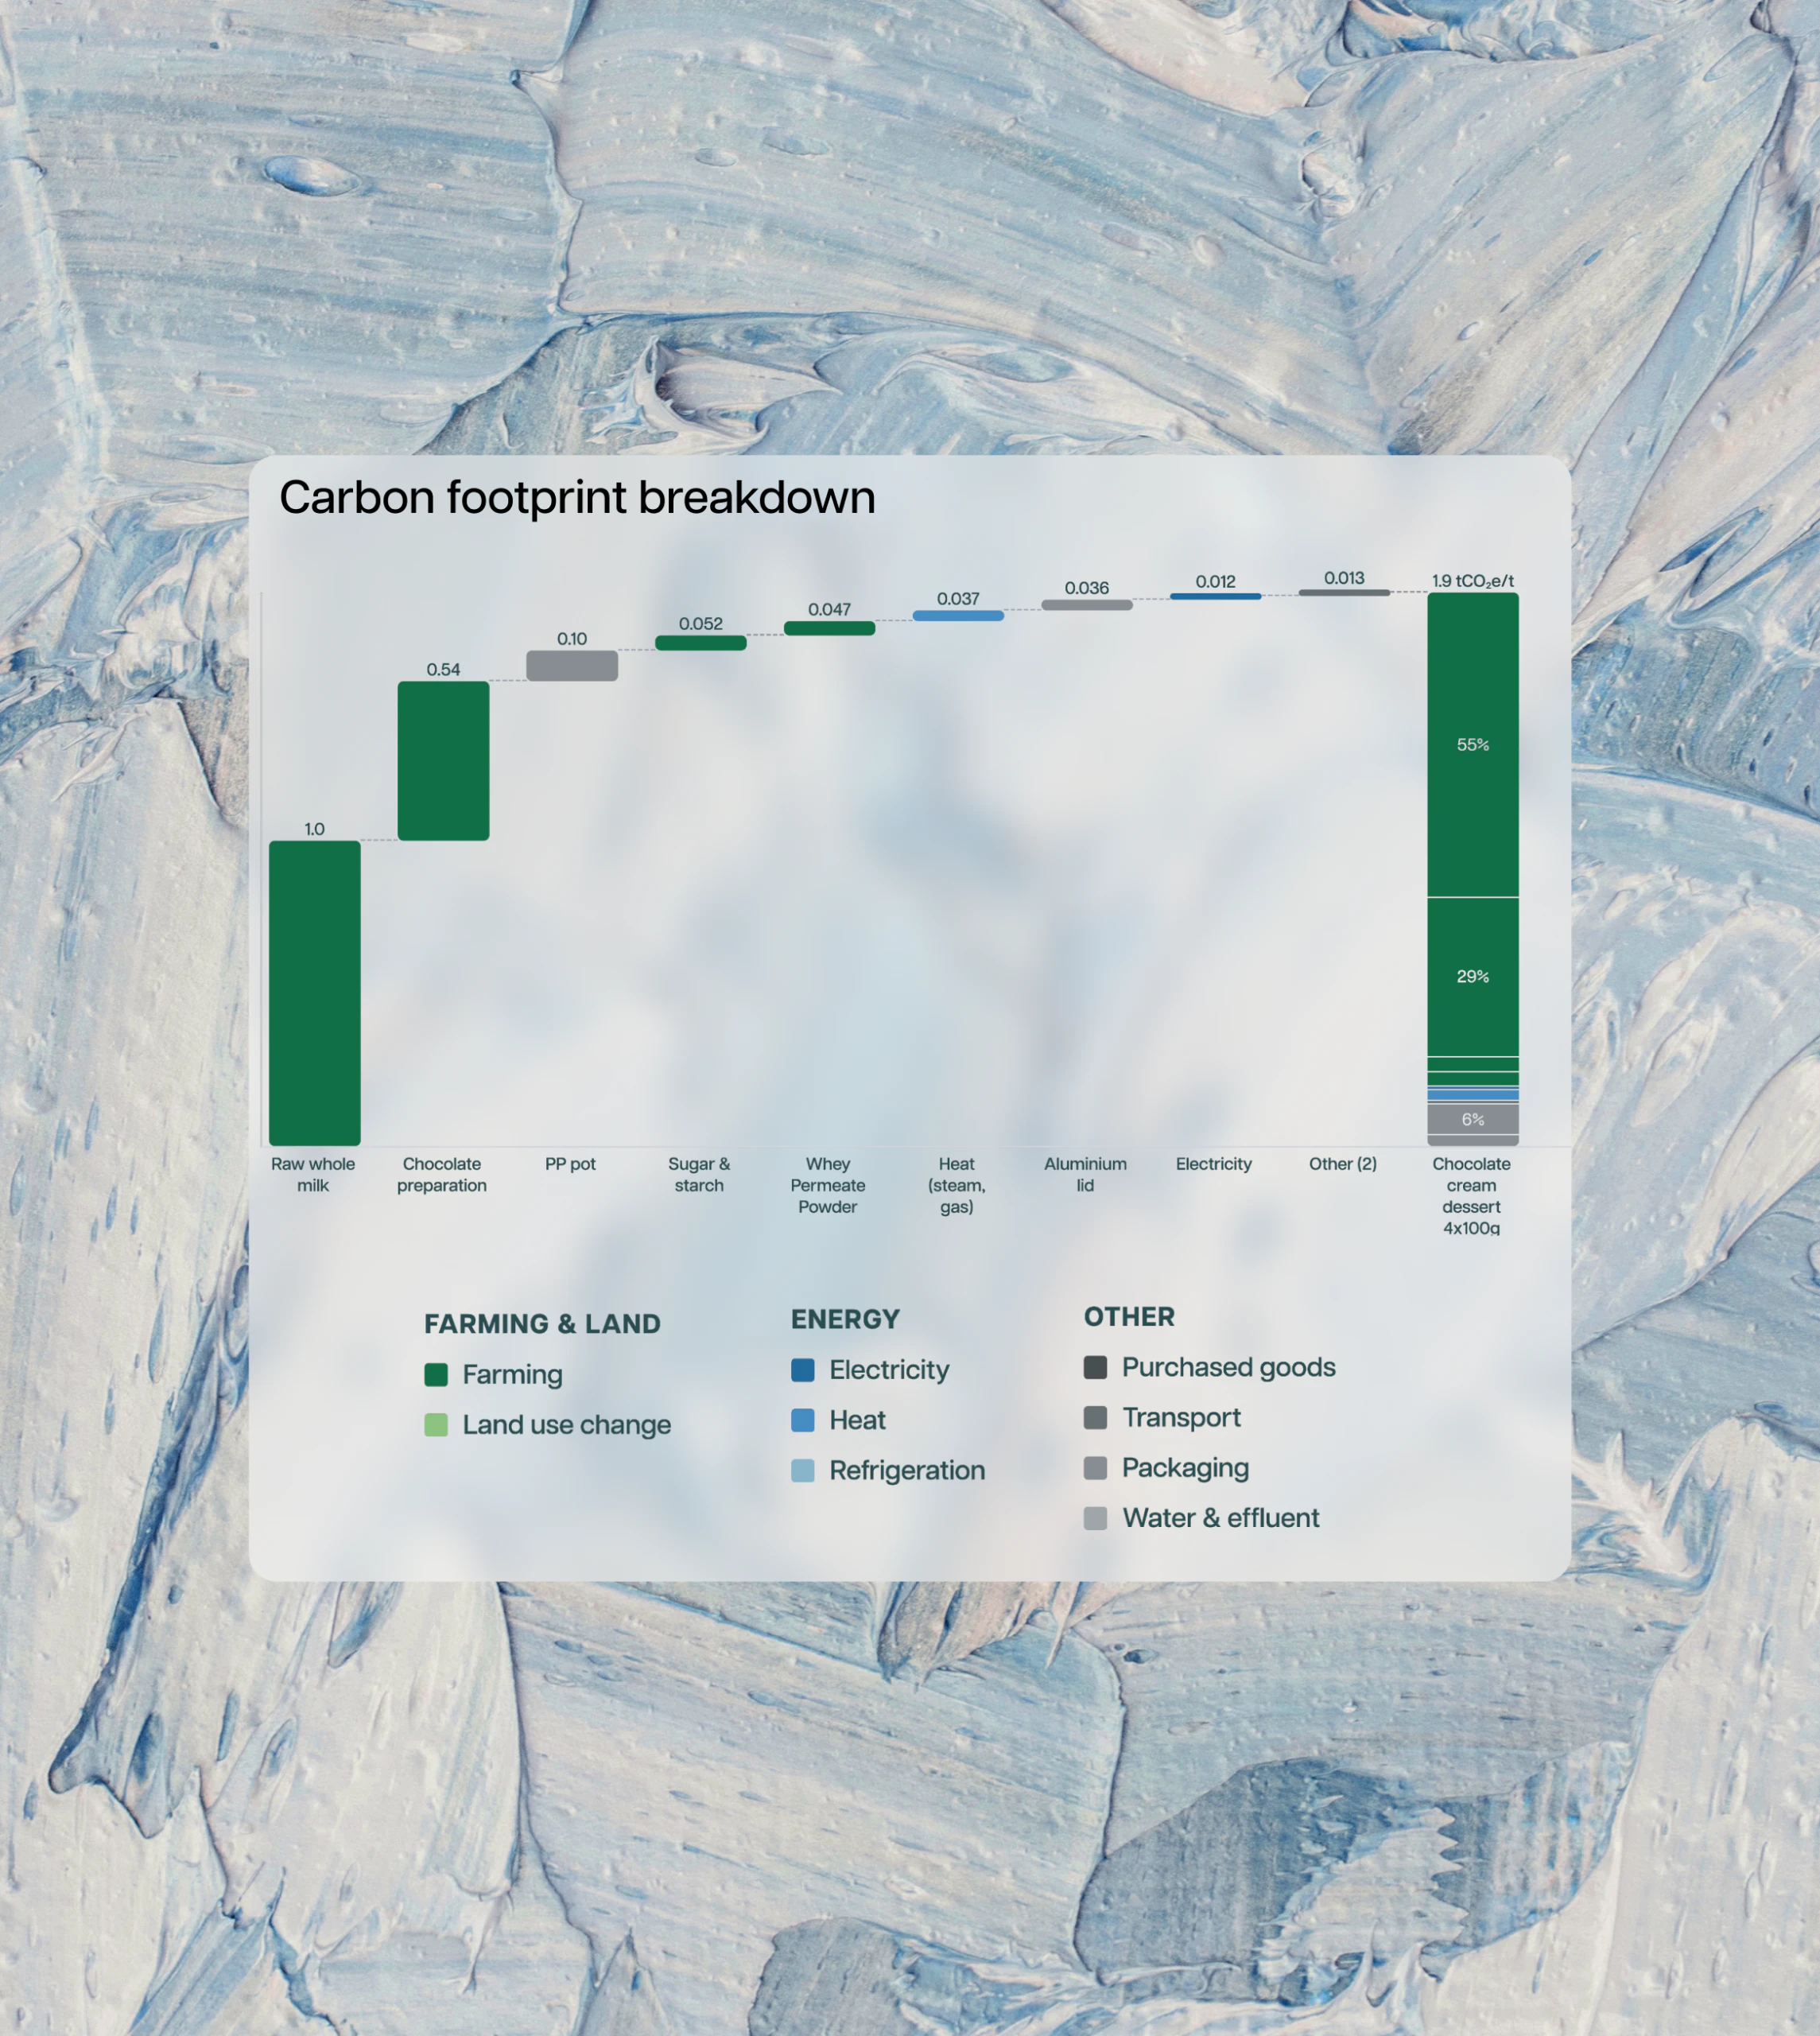
A contribution chart from farming to packaging, with an ingredient-by-ingredient table. Any line opens the factor behind it.
Reduce
Decarbonize
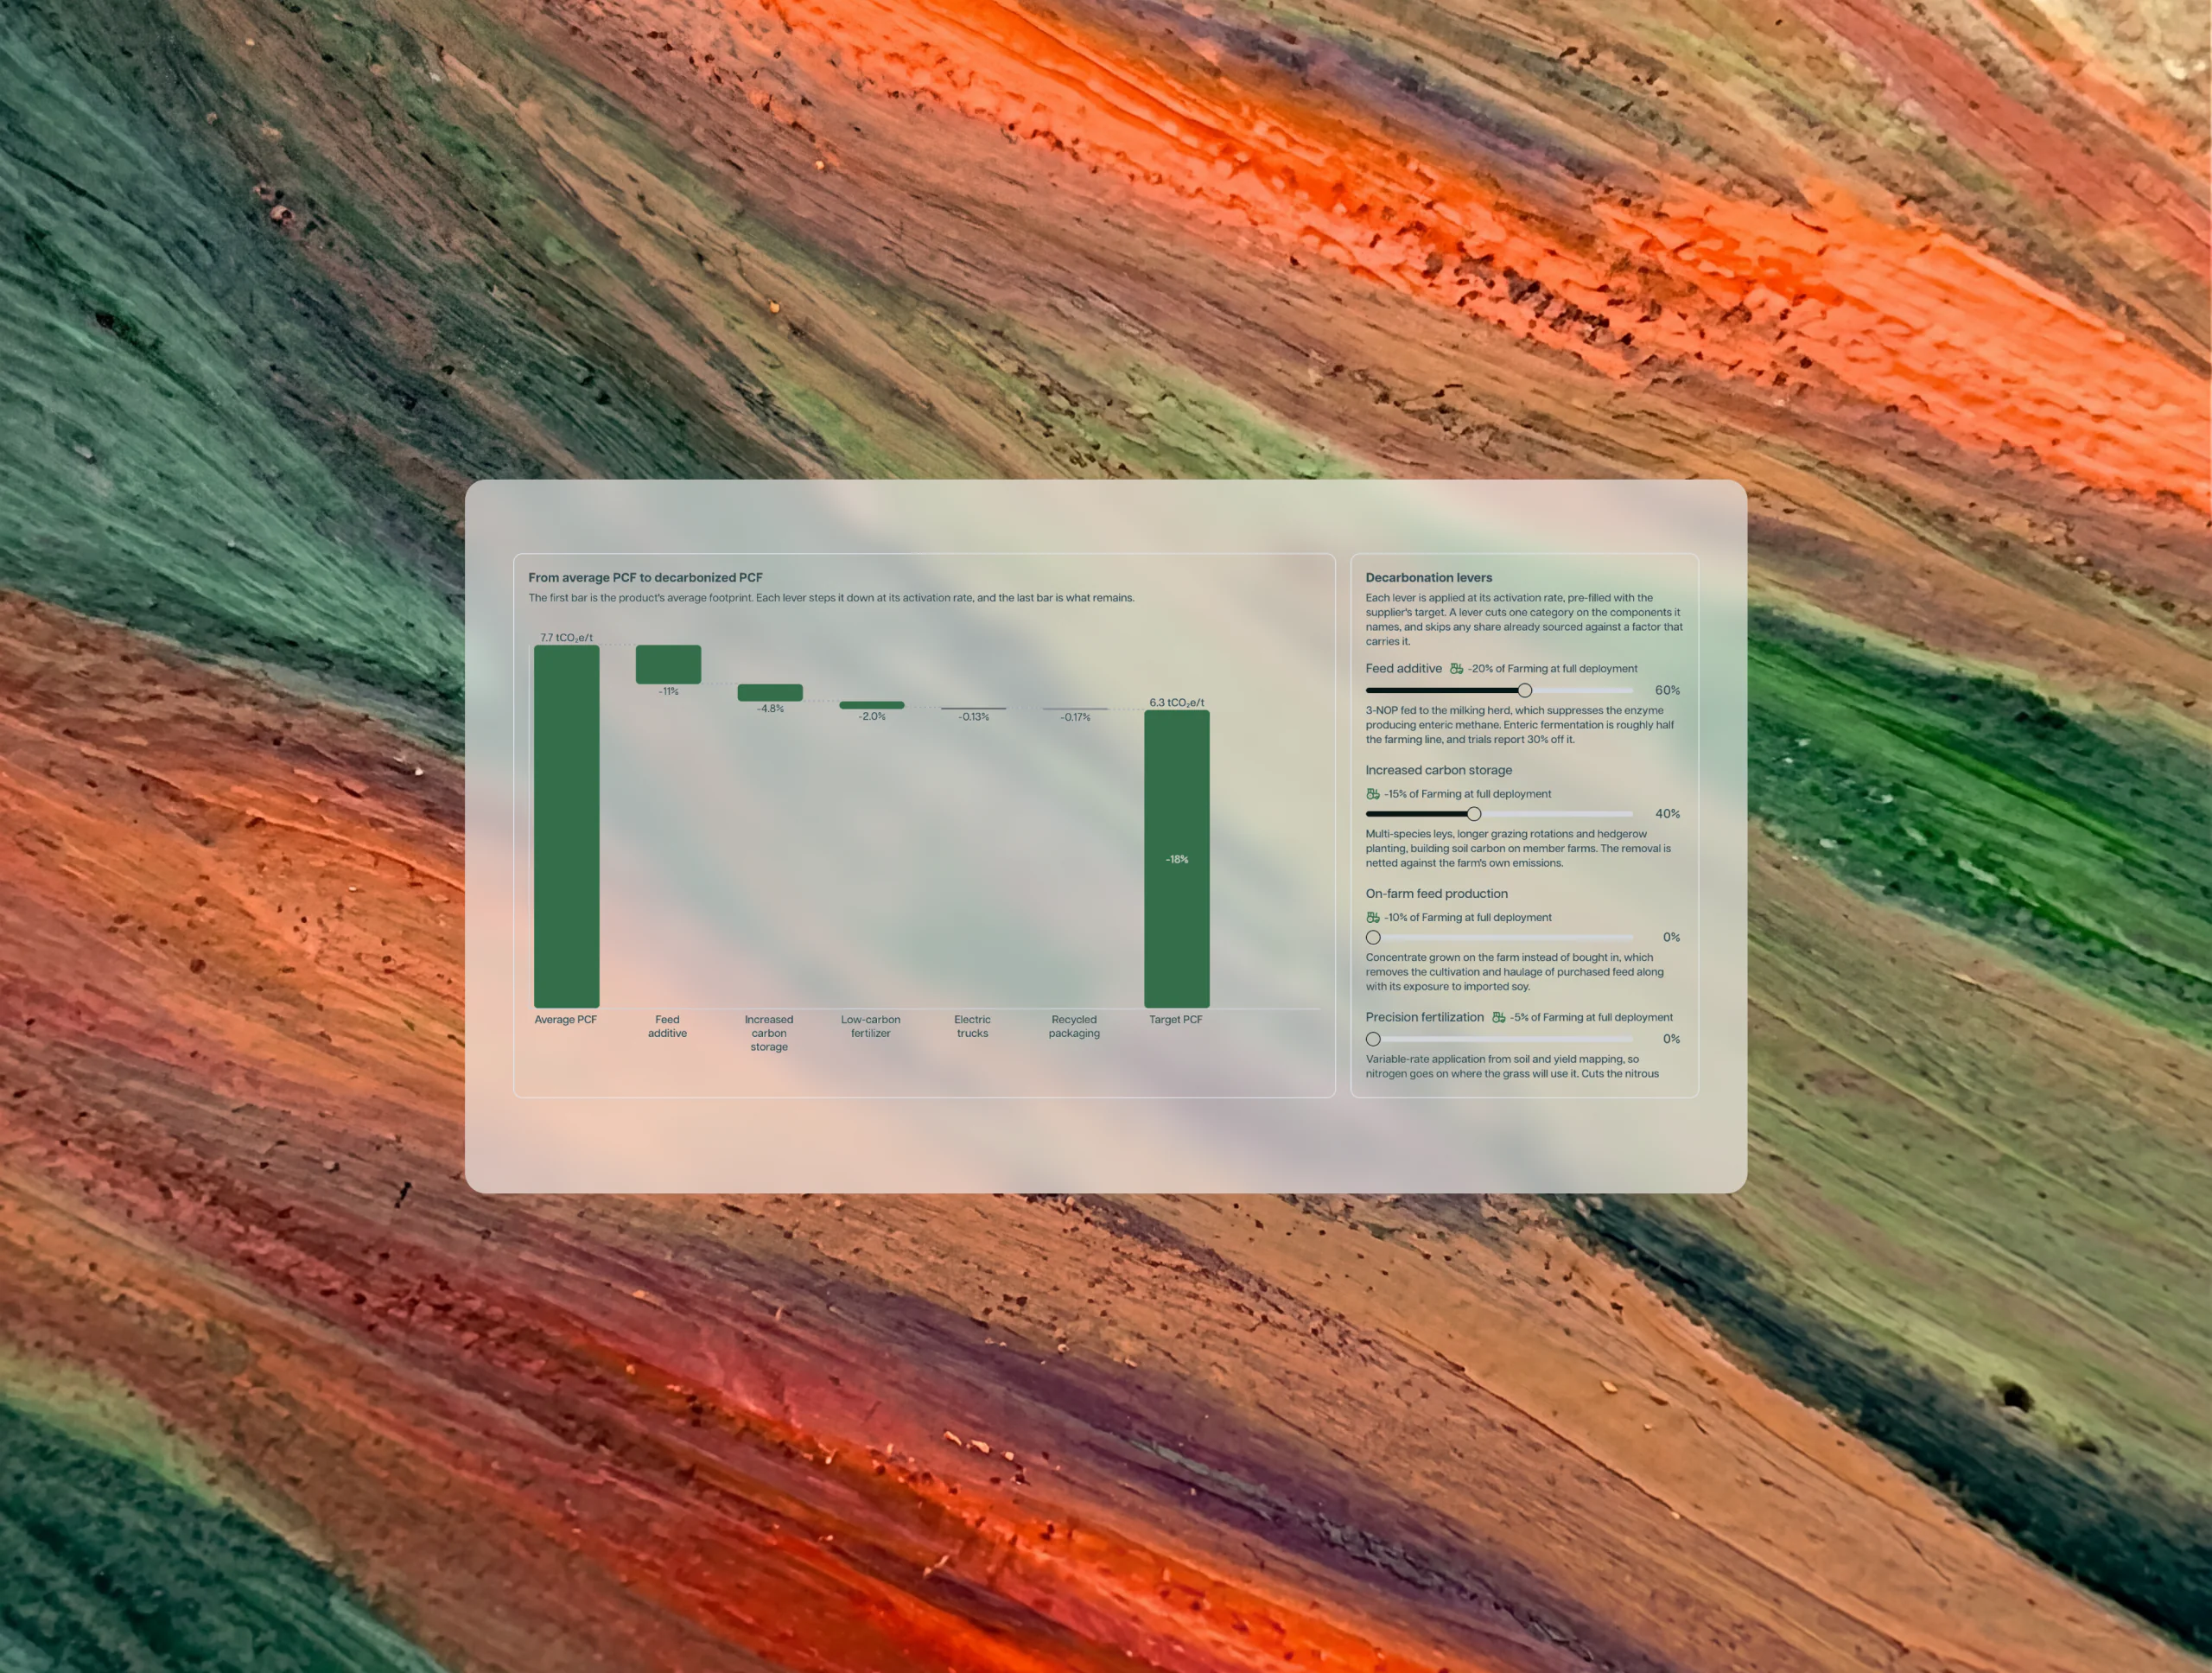
A waterfall from today's footprint to the decarbonized one. Drag a lever and see what each measure is worth before committing.
Allocate
Segment
Decide who gets to claim a reduction and see where the cut physically happens. Claims are tied to mass balance, never conjured on paper.
Q&A
Questions, answered.
What data do we need to start?
Your operational records: intake, transport, energy, recipes and packaging specifications, plus supplier figures where you have them. Segmos standardises them and keeps every row linked to its source.
Do we need a carbon measurement tool before starting?
No. Measure computes footprints from your operational data and matched emission factors. If you already use a tool, its output can be taken in through an API integration.
Which emission factor databases are included?
The catalogue holds more than 500 datasets, including: - ecoinvent. - Agribalyse. - ADEME. - USEPA Alongside your own supplier-specific and custom factors.
What happens once a footprint is finished?
It exports as a published PCF report, with previous versions kept. Every figure in it traces back through the factor that priced it, the supplier or dataset that provided it, and the source file that recorded it. From there, chain of custody takes the footprint from calculation to claim.